
Read the hand summary and profit trends
Check the sample, then read core metrics, fees, all-in EV and tournament luck.
On this page
Confirm the sample
Open Hand & Action Analysis → Summary. Check the database, game type, date filters and subset tags first. Position and session comparisons use the shared view scope. Compare conclusions for the same set of hands.
Core metrics and action groups
The dashboard has 12 metrics. Start with BB/100 and sample size, then choose a frequency to investigate using the definitions below. The large Won BB card also uses a per-100-hand result, rather than cumulative BB.
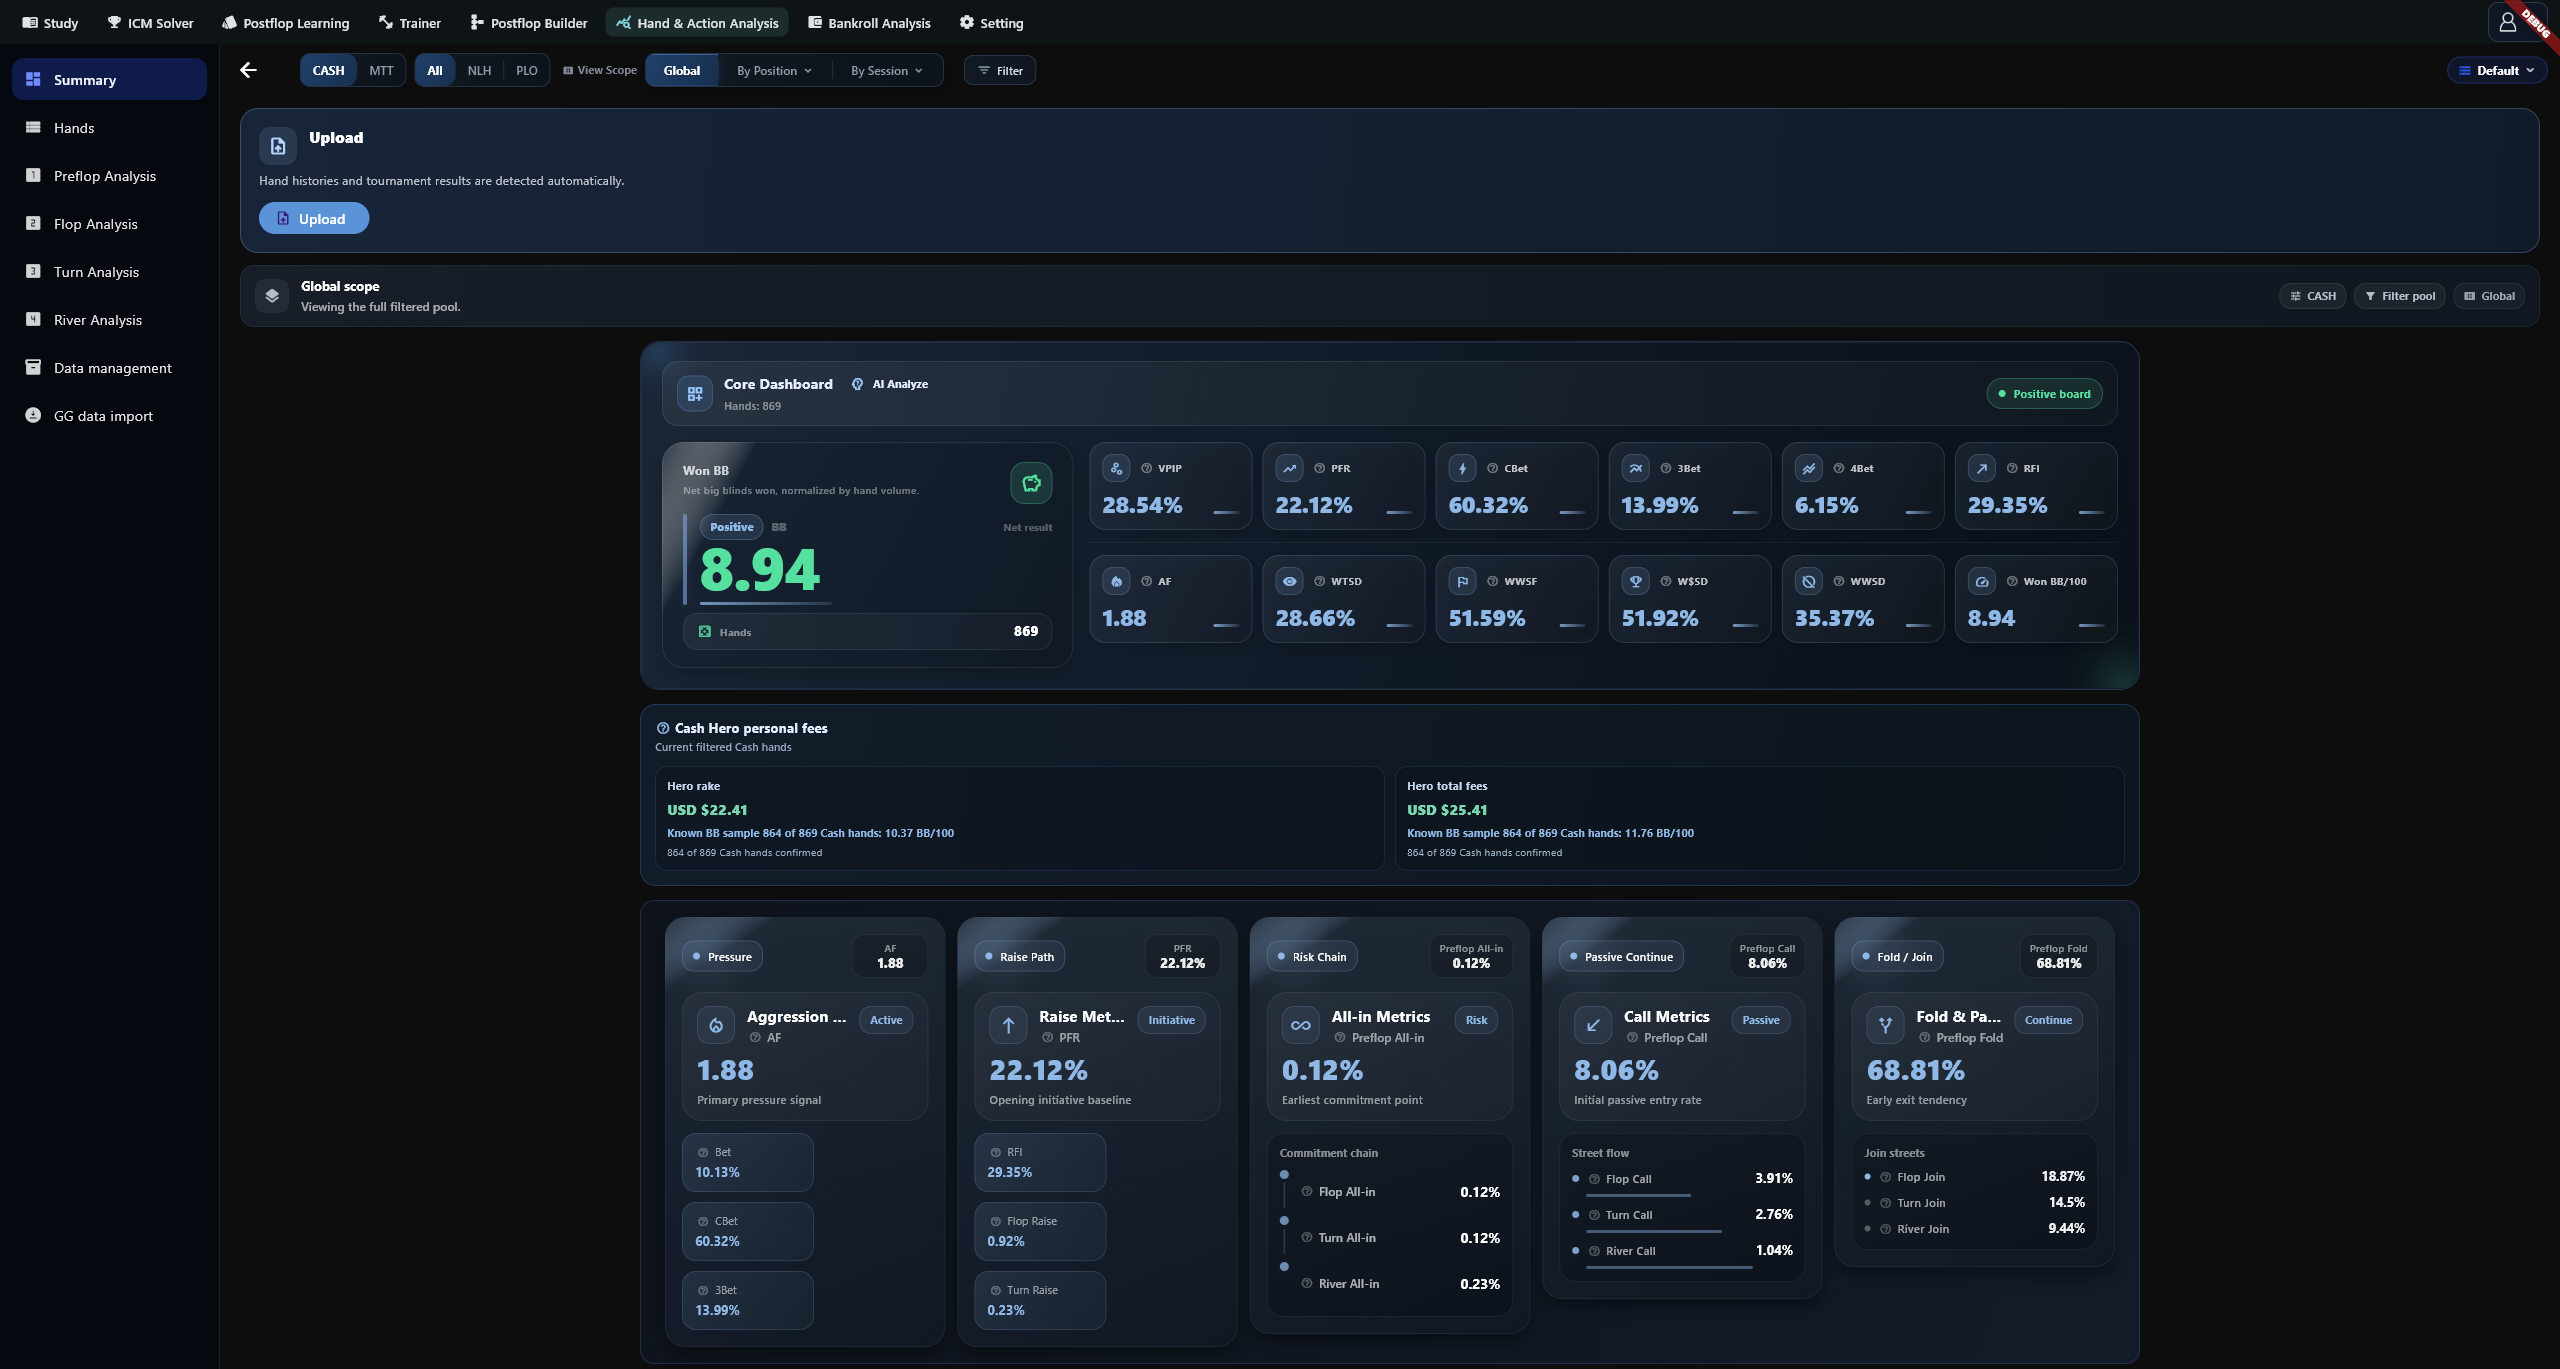
Grouped Bet and street-specific Raise, All-in, Call, Fold and Join figures use all analysed hands as the denominator. They count hands containing at least one matching action or reaching that street. Same-named street-page metrics can instead use eligible opportunities.
Profit trends and comparisons
Performance trend includes actual results, all-in EV, showdown and non-showdown curves. Choose 2k, 10k, 50k or All, or zoom, pan and drag the overview handles. AI trend analysis uses the visible interval; generate a new analysis after changing it.
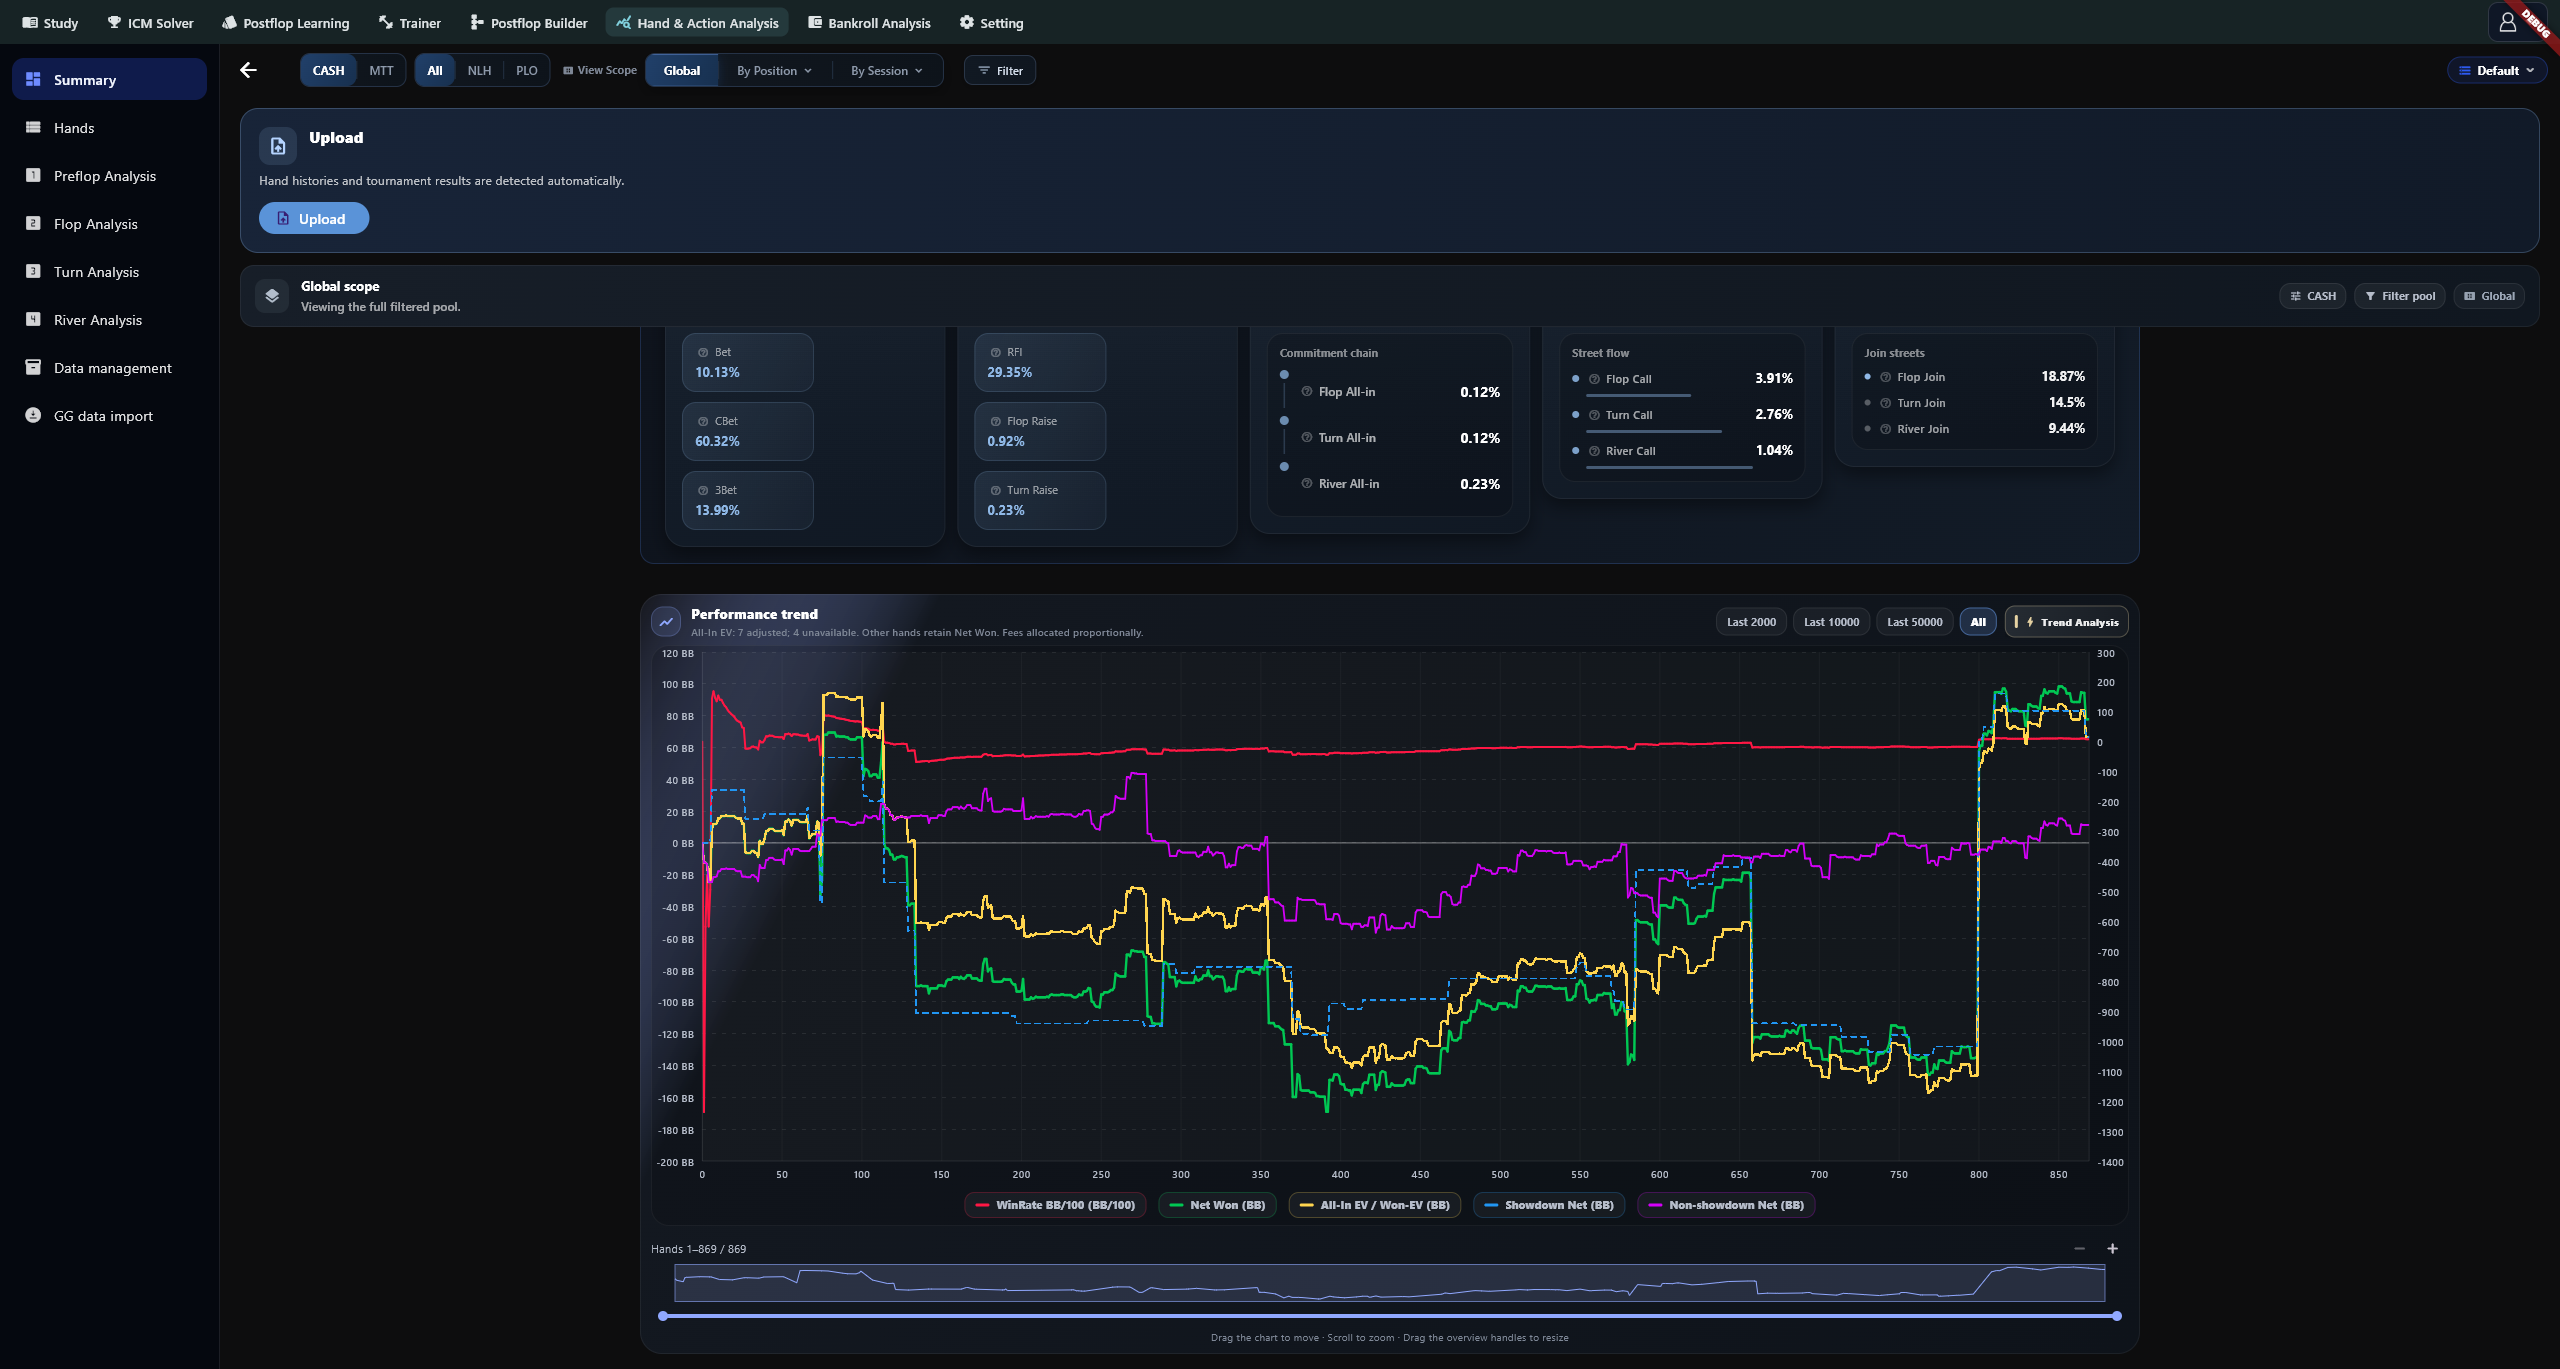
All-in EV adjusts only hands whose source records support an expectation calculation. Other hands retain their actual results. The gap between actual and EV curves therefore does not explain every win or loss. Open position or session comparisons, then inspect the related hands.
Cash fees and tournament luck
Cash Hero personal fees includes known fees attributable to Hero and separates currencies. Missing fees are not zero. Covered hands and the BB subset can differ. This card does not apply another adjustment to profit or EV curves.
For MTT, Luck Index is the median tournament luck index on a 0–100 scale, with 50 meaning on all-in expectation. Only computable all-ins count. It uses chip EV without ICM adjustment. Luck BB sums actual minus expected all-in results in BB. Outdrawn counts hands lost after getting chips in ahead before the river; river all-ins are excluded.
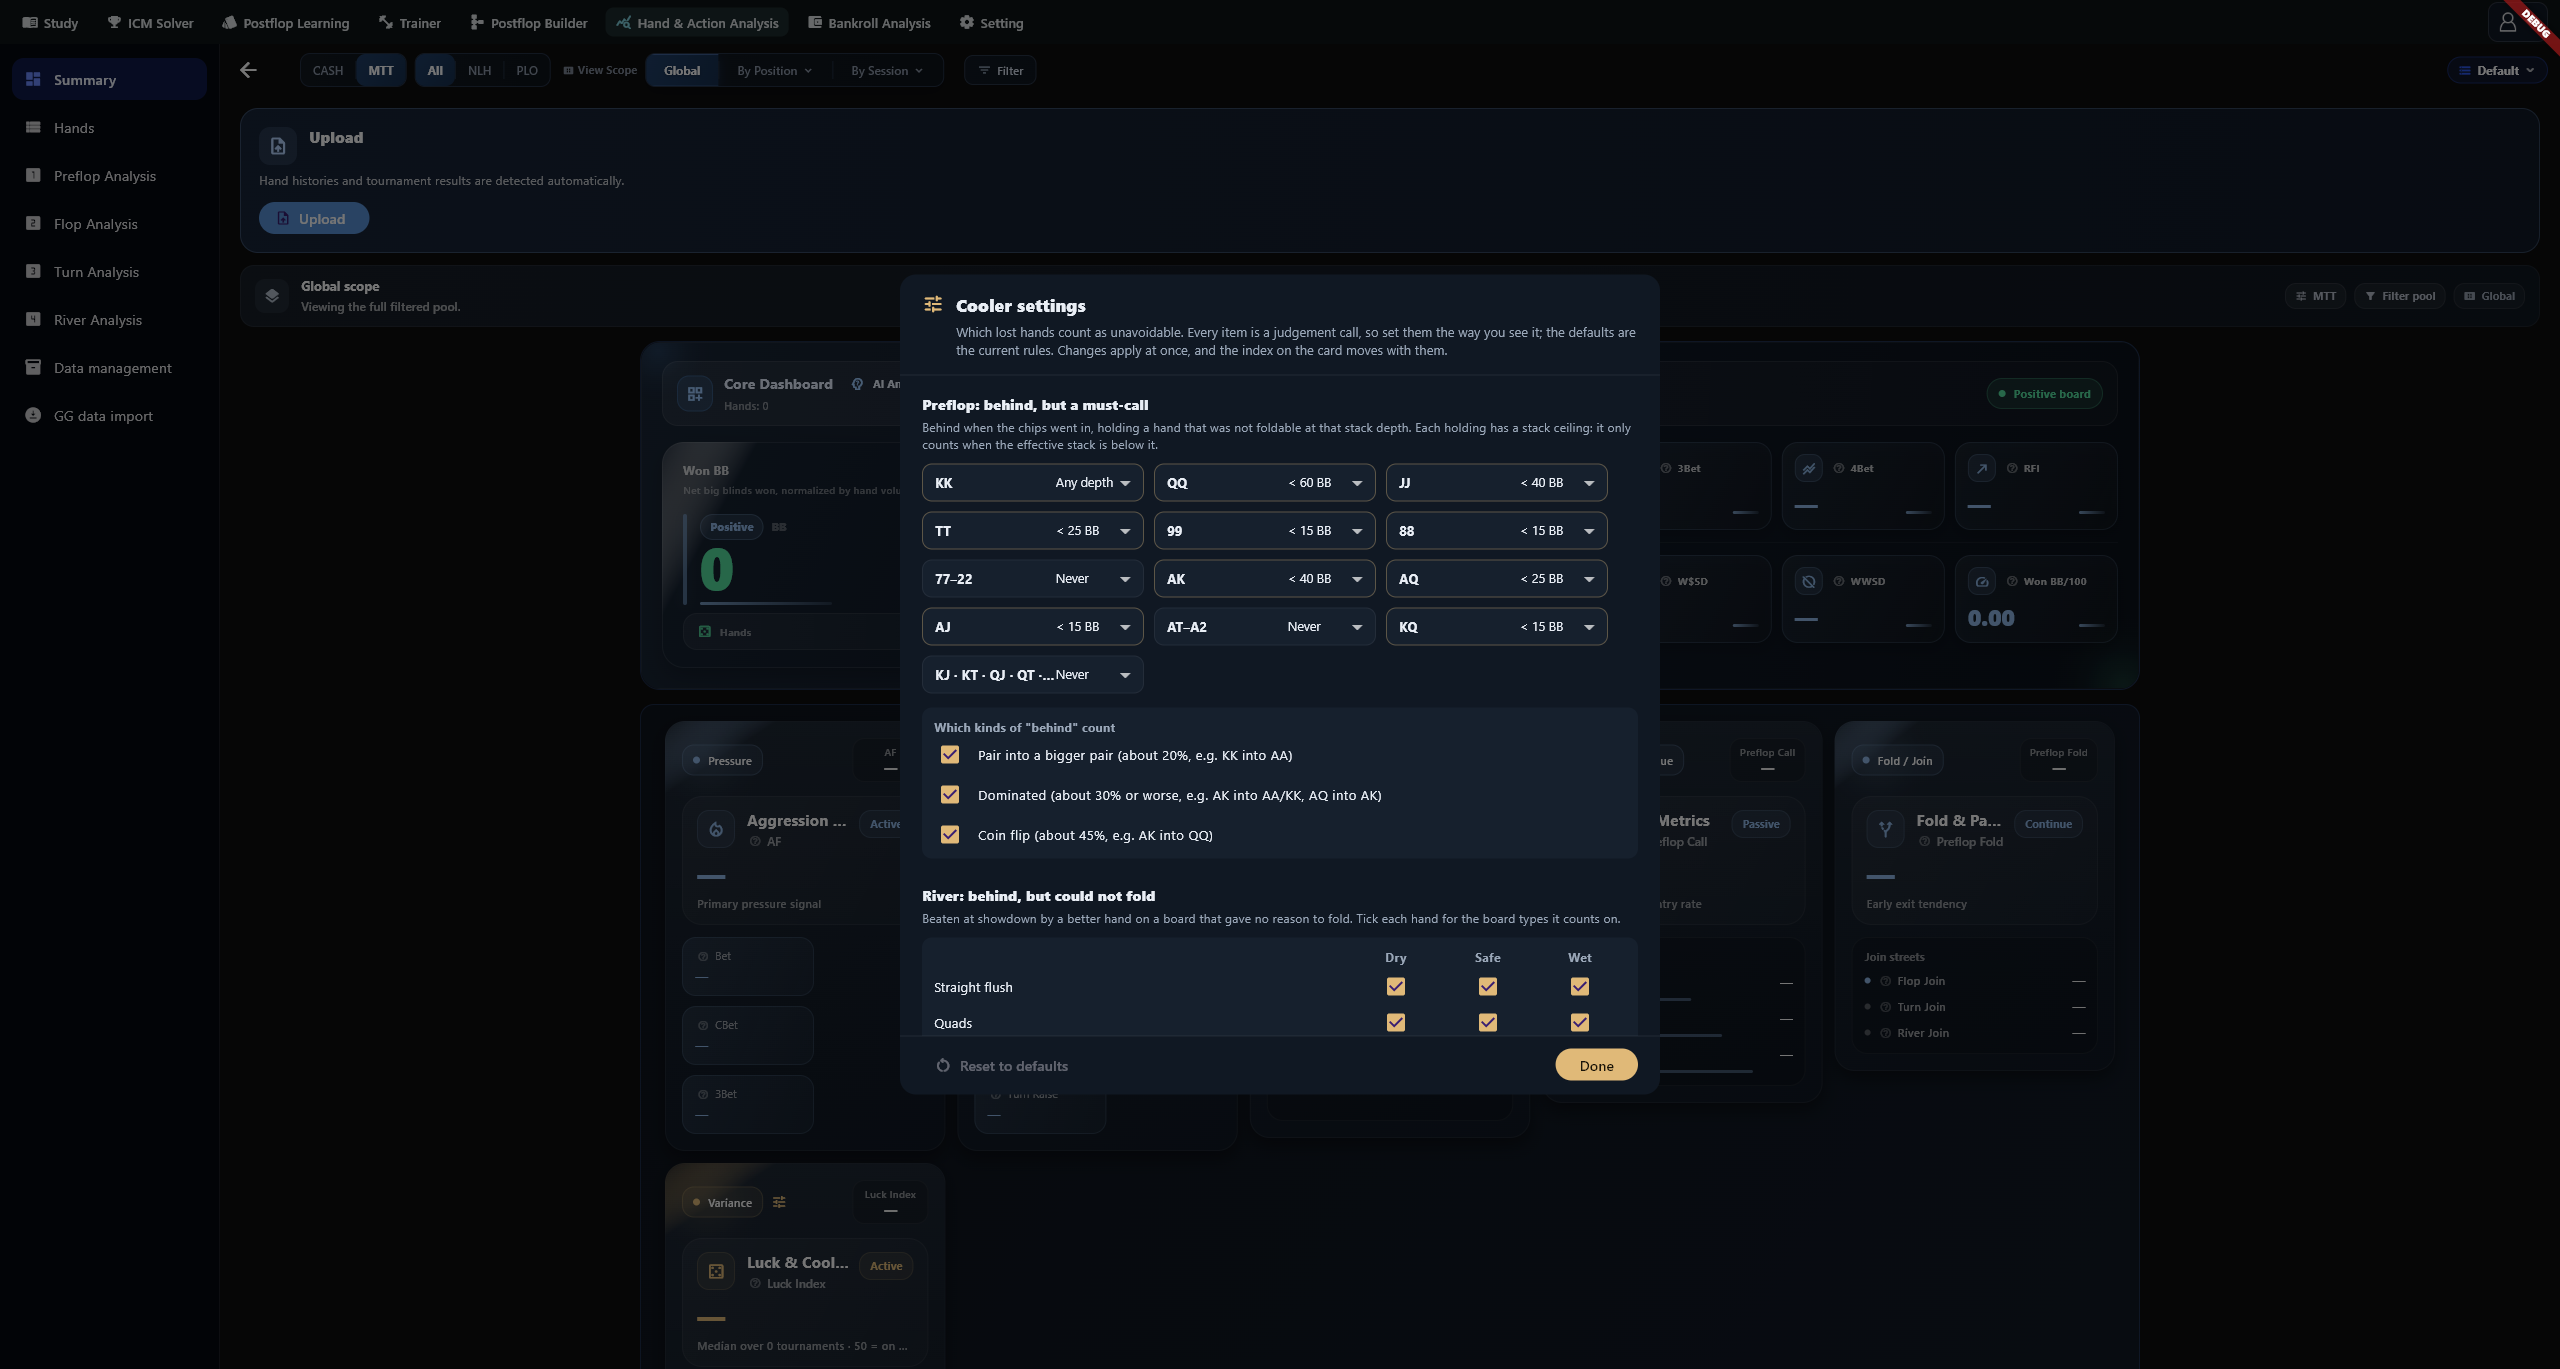
Cooler Index depends on the preflop ranges, stack limits and river hand categories in Cooler settings. Adjust the categories if needed, but their classification does not establish that a hand was unavoidable or replace reviewing it.
Core metric definitions
| Metric | Numerator and denominator |
|---|---|
| VPIP | Voluntary entries ÷ hands with a preflop decision; big-blind walks are excluded |
| PFR | Preflop raises ÷ opportunities to raise above the live price against an opponent with chips to continue |
| CBet | Total flop, turn and river continuation bets ÷ their combined street-specific opportunities |
| 3Bet | Preflop 3bets ÷ eligible opportunities facing a raise |
| 4Bet | Exact 4bets ÷ eligible opportunities facing a 3bet; 5bets and later raises are excluded |
| RFI | First-in raises ÷ first-in opportunities |
| AF | Postflop (bets + raises) ÷ calls; a ratio, not a percentage |
| WTSD | Showdowns ÷ hands where Hero took a flop action |
| WWSF | Pots won after taking a flop action ÷ hands with a flop action; folds and equal-best showdown ties count, lower-side-pot-only wins do not |
| W$SD | Wins against all showdown participants ÷ showdown hands; equal-best ties count, lower-side-pot-only wins do not |
| WWSD | Pots won without showdown after reaching the flop ÷ hands reaching the flop |
| Won BB/100 | Net BB won ÷ hands × 100 |
AF is ∞ when there are aggressive actions but no calls. A missing valid denominator produces —, which is different from zero.
AI and source checks
Select Analyze for the current sample. Complete AI configuration first. Generate a new report after changing the database, filters or visible trend interval. Check recommendations against opportunity counts, coverage and individual hands.
Missing or inconsistent metrics
Confirm the database and scope before comparing denominators. Missing fees, all-in expectations or tournament fields limit what can be calculated. Check the import result when records need completing.