
Compare profit metrics and record groups
Select trends, apply grouping conditions and interpret differences with sample coverage.
On this page
Choose a scope
Open Bankroll Analysis → Profit Analysis. Choose CASH, MTT or Combined and check the date range. Scope affects the whole page: trends, metrics and grouping choices. Combined compares both record formats and keeps grouping in Common mode.
Add trend metrics
Use Add metric and choose a date, record or Session x-axis. Several metrics can share an axis, with at most two unit types. Adding a third unit type replaces the existing selection. The final metric cannot be removed.
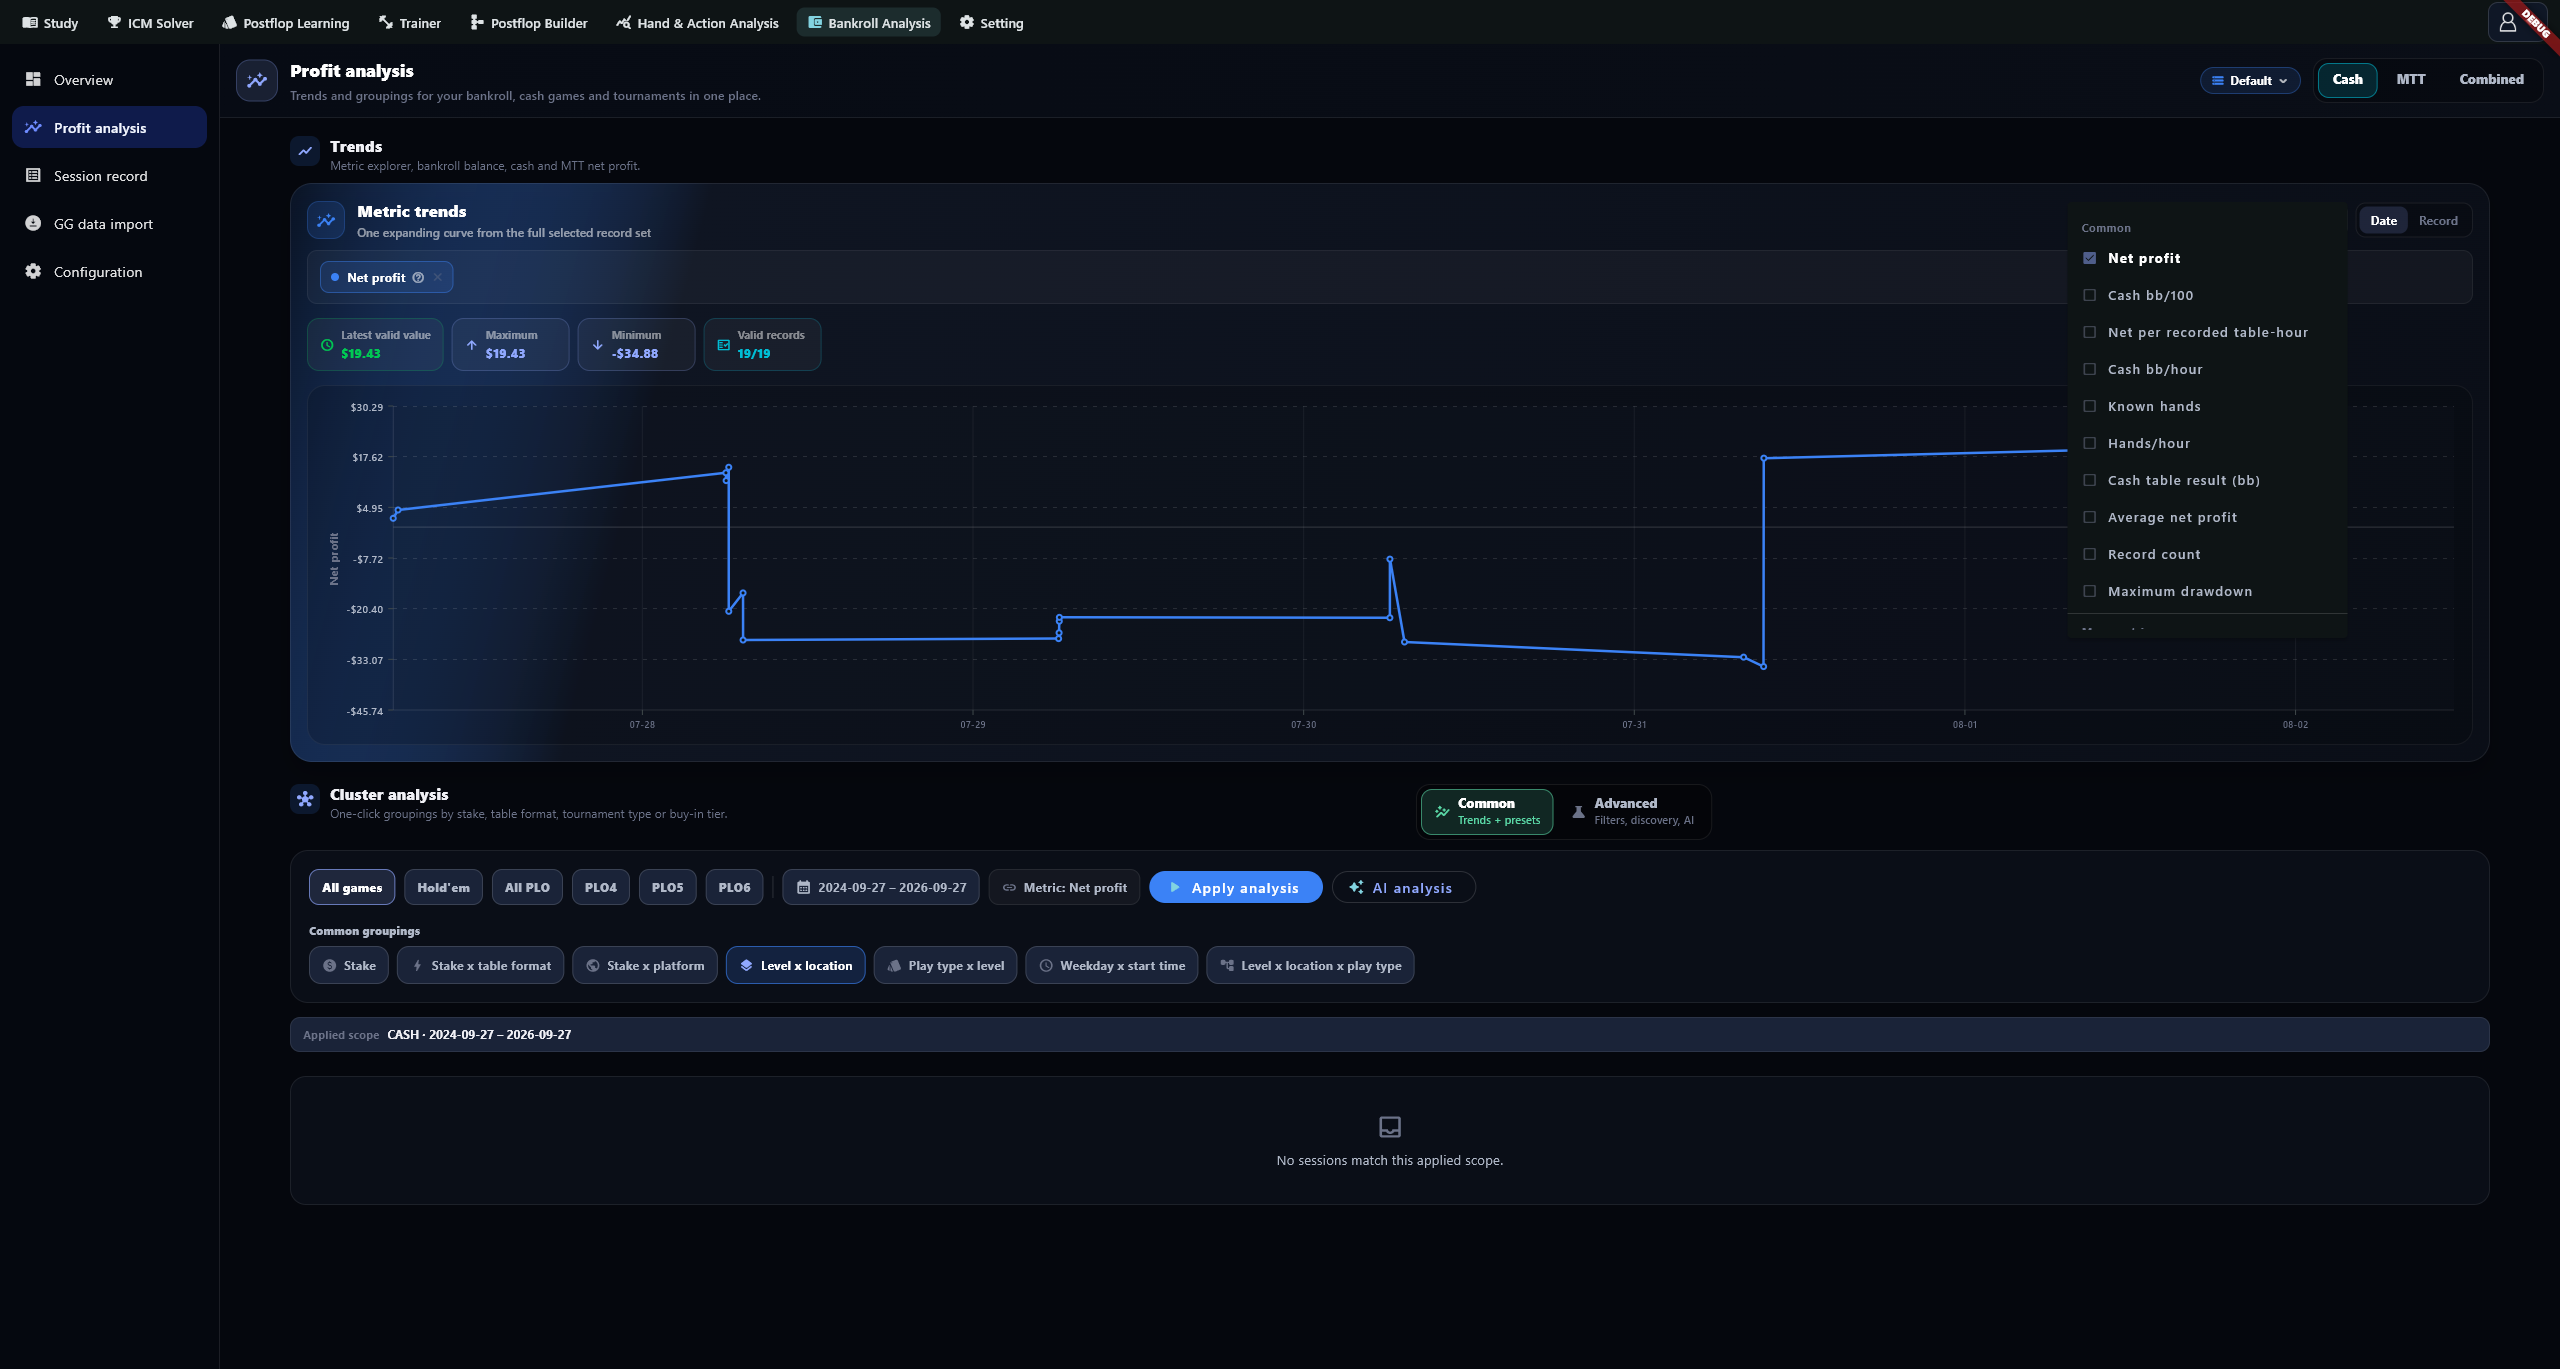
Grouping follows the first selected metric that supports grouping. Drawdown and streak metrics may fall back to net profit; check the metric shown in the group section.
Choose groups and apply
In Cluster analysis, choose dates, grouping dimensions and a minimum sample. Combine dimensions or leave them empty for Overall. Select Apply analysis after changes; until then, results describe the previous applied conditions.
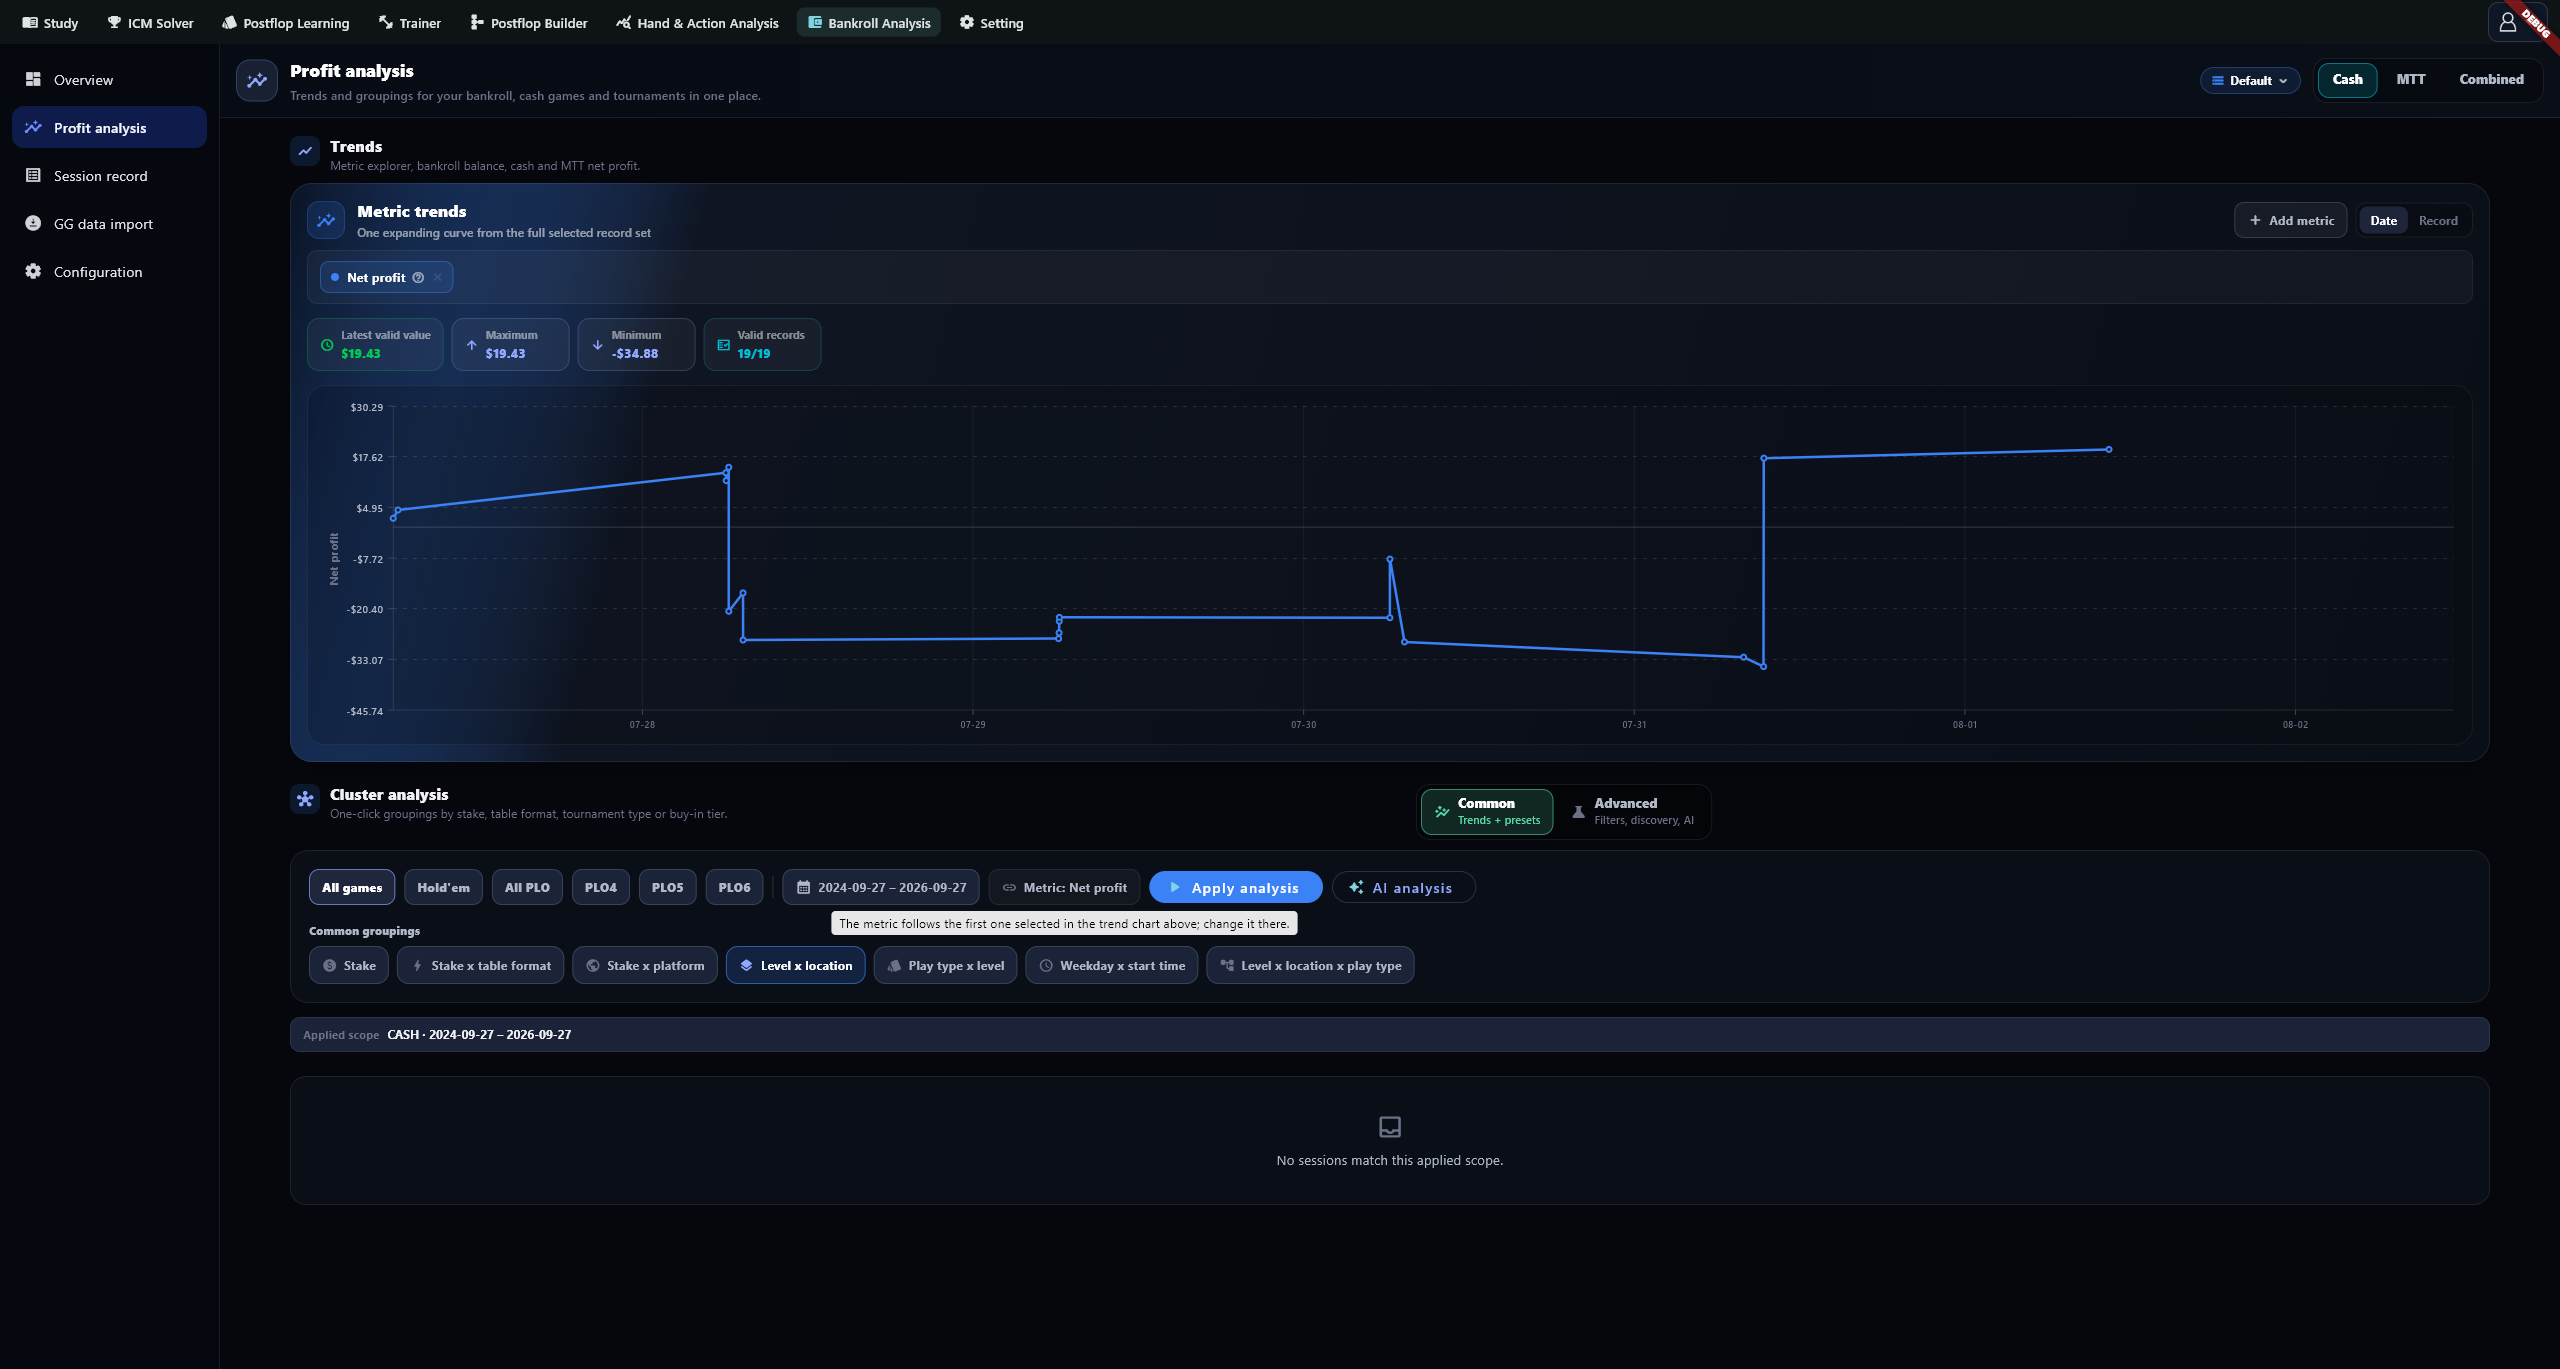
Read results and coverage
Check each group's record count, coverage tags and units before comparing it with Overall in the same applied scope or with the other half of the period. Missing hands, blinds, duration, payouts or fees change eligible subsets. — means unavailable. Small-sample markers, including groups below five records, are reminders; a sample floor is not statistical confidence.
Different combinations can contain the same record, so discovered groups cannot simply be added together. A difference between period halves does not by itself establish that a strategy change caused it.
Advanced filters and discovery
Within Cash or MTT, select Advanced, set Scenario filters and Group by, then apply. Scenario filters affect grouped analysis without changing the full trend above.
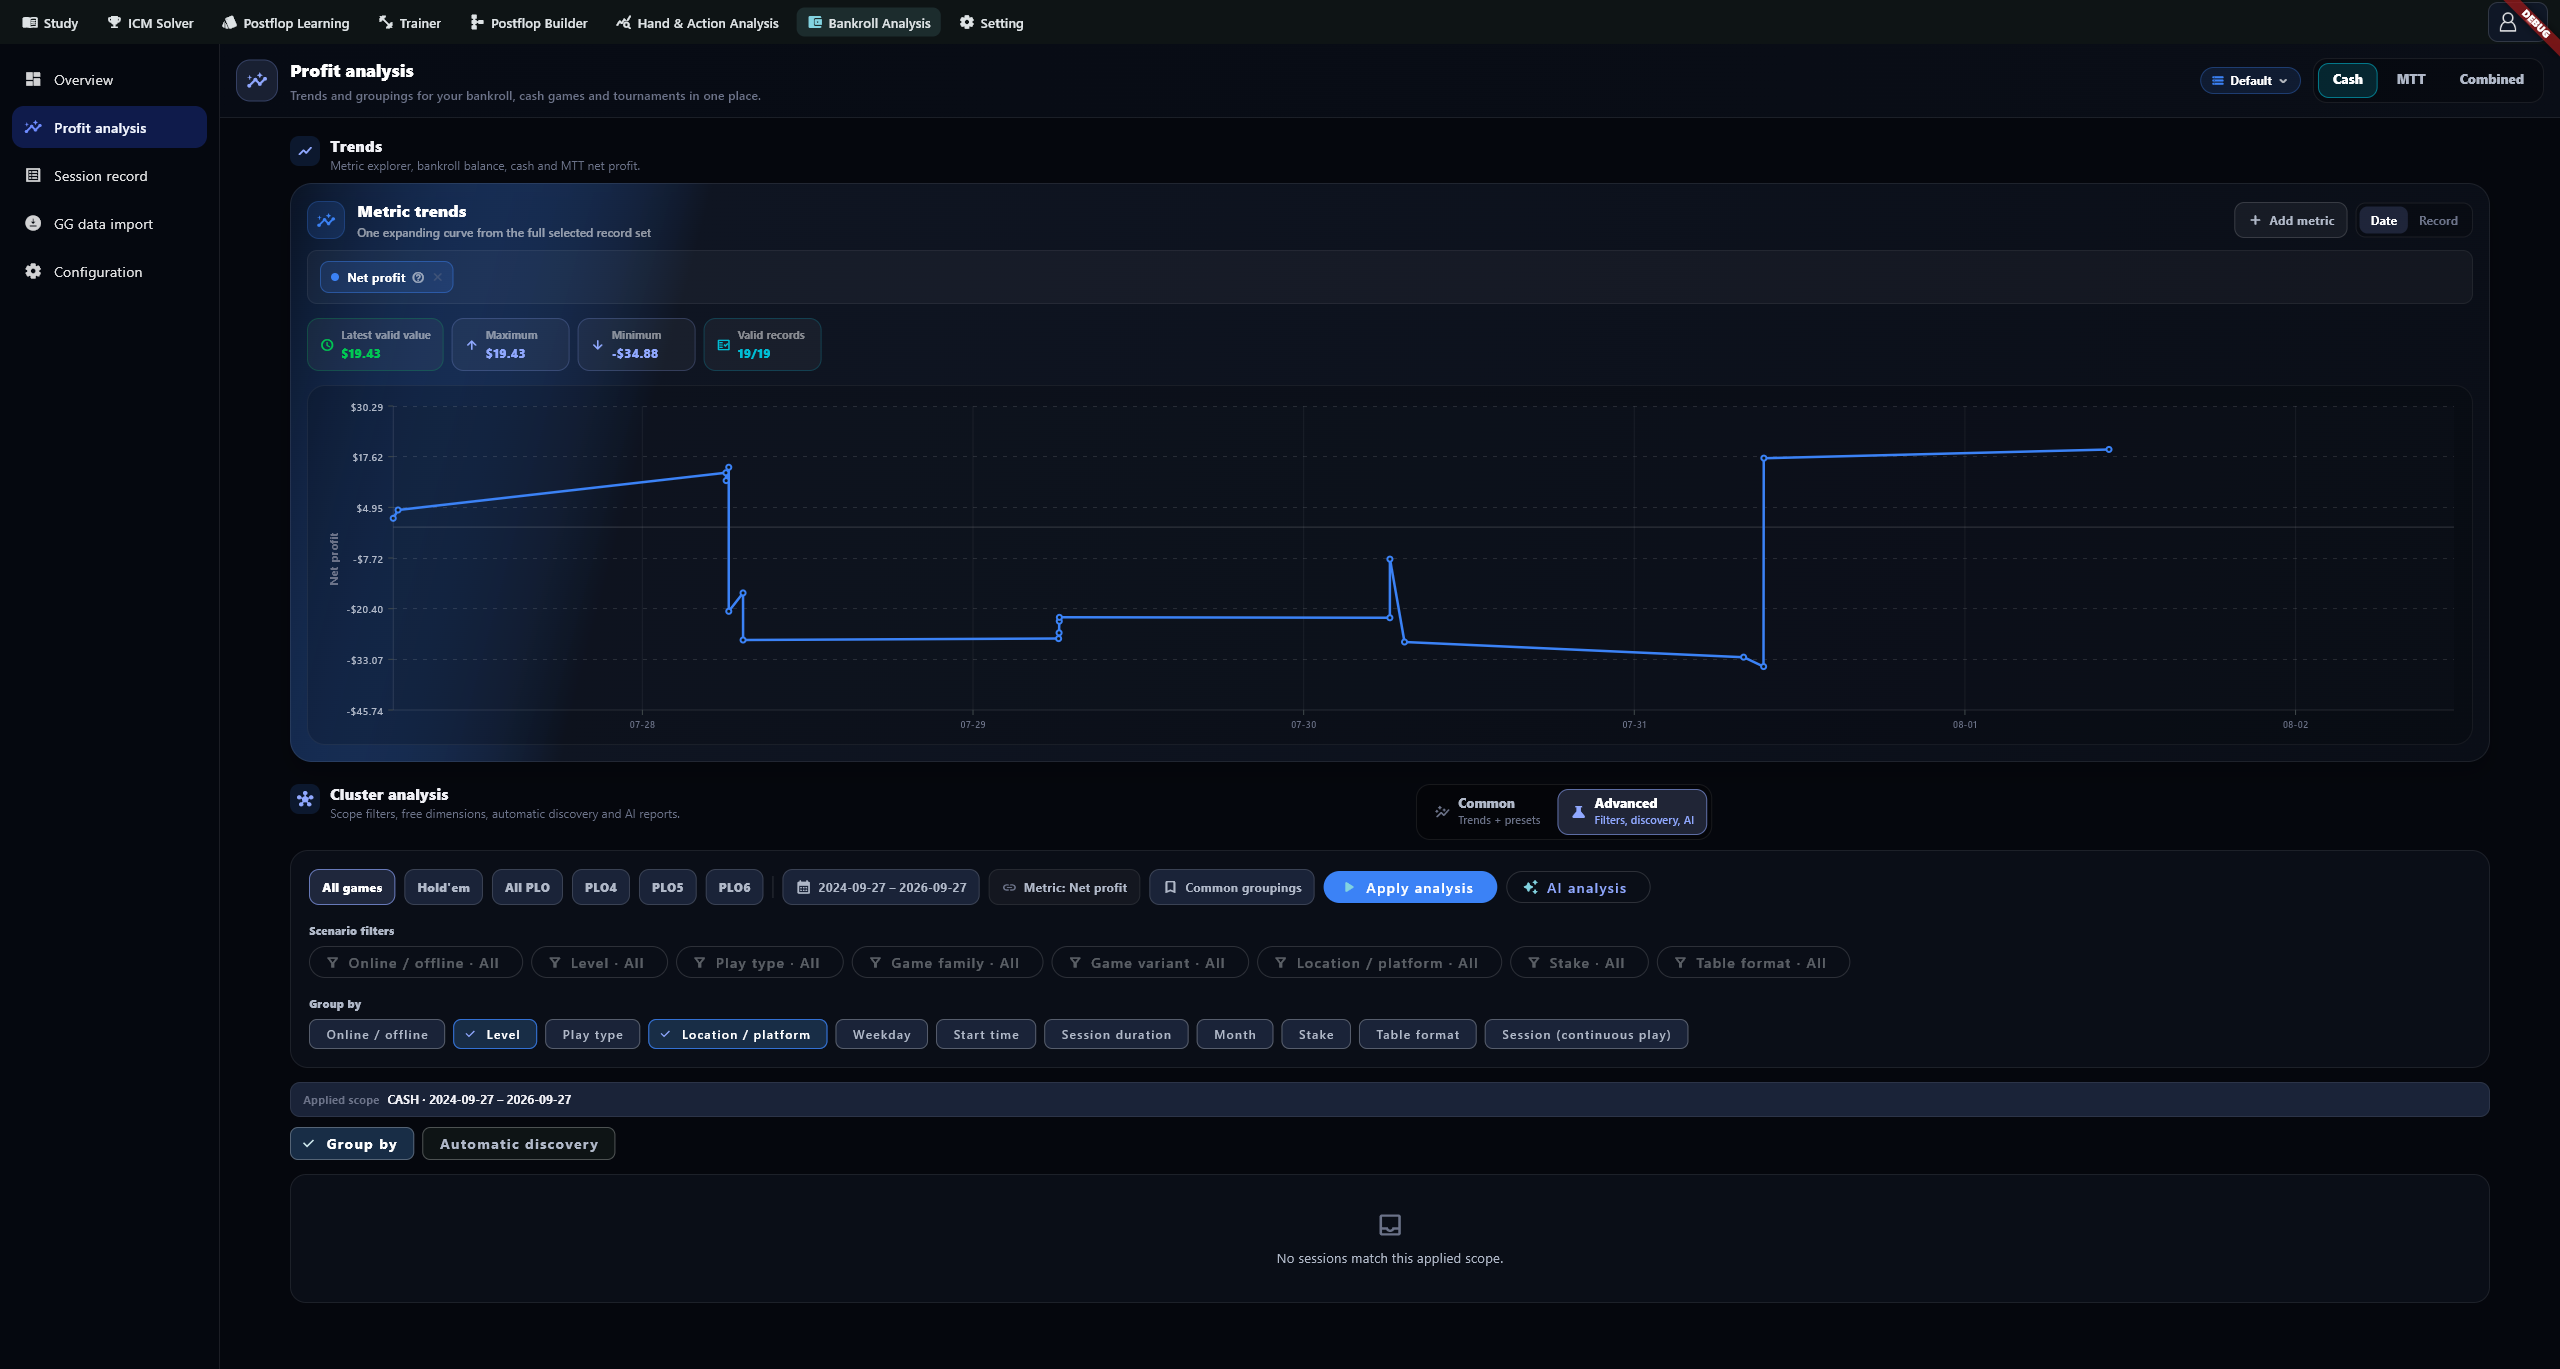
Use Automatic discovery to scan combinations. Stopping retains results already returned. If none qualify, check scope and sample floor; lowering the floor does not make the resulting groups more reliable.
Metric definitions
| Metric | Meaning |
|---|---|
| Net profit / Gross profit / Total costs | Running recorded net profit, gross profit before table costs, and recorded rake/tax/jackpot plus external expenses |
| Record count | Stored bankroll records, not settled tournament count |
| Profitable record rate | Positive-net records ÷ all records; not ITM |
| Average net profit | Net profit ÷ records |
| Profit factor | Positive net profit ÷ absolute negative net profit; unavailable until a loss exists |
| Current / Maximum drawdown | Current/largest decline from a prior cumulative net-profit peak starting at zero; not actual account-balance drawdown |
| Winning / Losing streak | Consecutive positive/negative records; zero or an opposite result breaks the sequence |
| Net ROI (record basis) | Net profit in the positive-buy-in subset ÷ corresponding buy-ins × 100 |
| Average ROI (record basis) | Arithmetic mean of individual net ROIs in that subset; not buy-in weighted |
| Known hands / Hand-count coverage | Sum of positive known hands / share of records with positive hand counts |
| Recorded table-hours | Sum of valid start/end durations, potentially including estimated tournament endings; overlapping tables add together |
| Net per recorded table-hour | Net profit from valid-time records ÷ their table-hours |
| Cash table result (bb) | Sum of (gross profit − rake − tax − jackpot) ÷ blind; external expenses excluded |
| Cash bb/100 | Eligible after-cost table BB result ÷ corresponding hands × 100; valid blinds and hands required |
Record net ROI has a different cost basis from Overview's tournament ROI. Recorded table-hours also differs from Overview's hourly metrics excluding estimates. Multitable hours are not elapsed wall-clock time.
AI reports
Open Cluster AI analysis and check Date range, Dimensions, Metric, Sample floor, Groups sent / total and Applied filters. The report describes that snapshot. Select Refresh after Snapshot changed appears. Groups not sent are outside the report's coverage.
Empty or stale results
For Filters changed, select Apply analysis. For No sessions match, check dates and format. For This metric cannot be calculated, supply the required fields or choose another metric. Retain loading errors before retrying.